Fifteen years ago, I stood on a dusty Little League field. I had a clipboard and a stopwatch, but they didn’t reveal much. This is where youth baseball technology comes in.
Let’s get one thing straight: it’s not about turning kids into robots. It’s about solving real problems. In elite sports, every little detail matters. Coaches and athletes look for that 1% edge. But do you need a $3,000 launch monitor, or is it just about Johnny’s batting?
The sports AI market has grown to over $2.5 billion. Tools like Zone7 have cut injuries by 40% at pro clubs. But the goal of baseball coaching technology is to help coaches, not control them. This article will show you tools that really help youth programs, without needing a PhD or a second mortgage.
Video First: Two-Angle Capture, Checklists, and Free App Workflows
If I had to pick one key tool for youth coaches, it’s a smartphone tripod. Why? Because video analysis unlocks a player’s full ability. Forget fancy gadgets; this simple tool changes coaching a lot.
Video analysis today is easy. You need two angles: a side view for swing plane and hip rotation, and a front view for head movement and stride. This is way better than what coaches used a decade ago.
Thanks to new tech, video analysis tools are almost free. Apps like Coach’s Eye make it easy to use your phone’s features and free platforms. You don’t need to spend a lot on subscriptions.
The right workflow is key. It makes you a pro, not just a beginner. Start with a checklist—stride length, bat path, contact point, head position—and check it off like a pilot. This methodical approach helps you focus on what’s important.
Remember, data doesn’t lie, but it doesn’t explain itself. That’s where you come in. By sharing your insights with players and parents, you help them understand their progress and what they need to work on.
Hitting Metrics: Bat Speed, Attack Angle, Contact Point—Use Responsibly
Imagine telling a young player their bat speed is 52 mph, when the “ideal” is 65. It’s a big shock! They might feel like their bat isn’t good enough or want to play chess instead. This shows why hitting metrics can be tricky.
Metrics like bat speed, attack angle, and contact point seem exciting. They offer clear insights, but can lead to wrong conclusions if not used right. Tools like Blast Motion make these metrics easy for everyone to see. But, with this power comes a big responsibility.
The real truth is, a 12-year-old with a bat speed of 52 mph who hits the ball well is more valuable. They’re better than someone who swings at 65 mph but misses a lot. The aim should be to help the athlete get better, not to make them feel bad with a number.
- Use metrics to identify patterns: Track progress over time, not just one reading.
- Context is key: Remember, metrics are just a part of the athlete’s journey.
- Prioritize development: Focus on getting better, not comparing to an ideal.
The best coaches see Blast Motion data as a medical test result. It’s interesting and useful, but only with the right context. Always remember, one number at a time is the way to go.
Pitching Metrics: Velo, Spin Axis, Release Height—Simple Reports Parents Understand
Let’s make pitching metrics easy for parents to get. Tools like Rapsodo help show if a young baseball player is getting better. Parents want to see their child’s progress, not complicated terms.
Velocity is simple: it’s about throwing the ball harder. But what about spin axis and release height? These might sound complex, but they offer key insights into a pitcher’s skills.
The spin axis shows how the ball spins. A steady spin axis means better control. If a pitcher’s spin axis improves, it shows they’re getting better at gripping and moving their wrist. This is a big win for them.
Release height is about how consistent the ball is thrown. A consistent release height means better performance. If a pitcher’s release height gets steadier, it’s a sign of good progress.
A one-page summary is key. It should answer three main questions:
- What changed?
- Why does it matter?
- What are we doing about it?
If you can explain these in a short walk, you’re on the right track. If not, it’s time to rethink how you share the data.
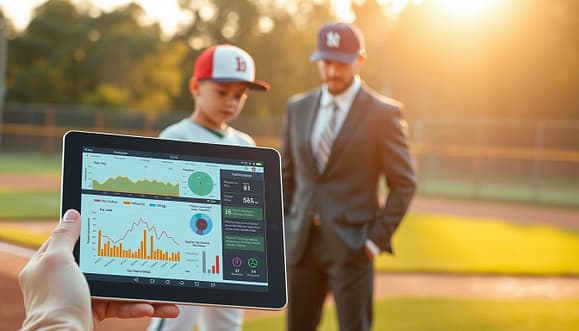
| Metric | Definition | Importance |
|---|---|---|
| Velocity | Speed of the pitch | Shows overall power |
| Spin Axis | Angle of ball rotation | Affects control and movement |
| Release Height | Height at which the ball is released | Impacts pitch trajectory |
By focusing on these, coaches can give parents clear insights. The goal is to make complex data easy to understand. We’re all working together for the player’s success.
Low-Cost Timing and Throwing Tools: Pocket Radar, Jump Mats, Contact Grids
In youth baseball coaching, simple tools can make a big difference. Forget the fancy gadgets. Low-cost tools can change the game.
The Pocket Radar is a great example. It costs about $300 and measures speed accurately without any subscription fees. It’s a rare find in sports tech, letting coaches focus on athlete performance.
Jump Mats measure lower-body power through vertical leap. You can make one with a smartphone app and a flat surface. It shows how tech can be simple yet powerful.
Contact Grids are marked zones on a net or screen. They give instant feedback on bat control. No need for coding! They show what matters, right away, so athletes can practice.
The stopwatch and tape measure didn’t disappear because they were bad. They were forgotten because we thought more complex tools were better. But a coach with a Pocket Radar and a contact grid can spot problems faster than one with a $5,000 simulator.
The best technology is often the simplest. Use these low-cost tools, and you’ll see coaching isn’t just about gadgets. It’s about understanding the game and the players.
For more on how biomechanics can help youth, check out why biomechanics matters for youth.
Scorekeeping and Spray Chart Apps for Objective Feedback
Forget the unreliable stories from parents; scorekeeping apps and spray charts give you hard facts for youth baseball technology. Imagine asking three parents about the third inning. You’ll get three different stories, each more outlandish than the last. These apps change how we track player performance.
Platforms like GameChanger and iScore turn old scorebooks into searchable databases. They show the truth about player tendencies. Where does Billy actually hit the ball? Not where you think, but where the data shows.
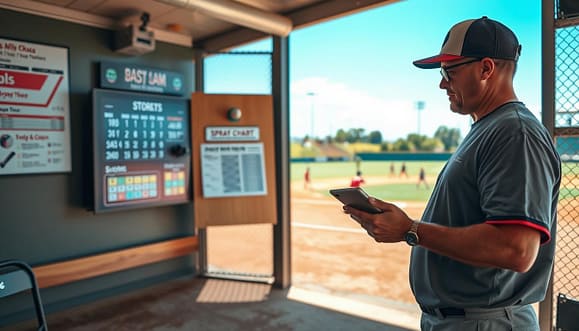
Spray charts reveal surprising patterns. Your “pull-happy” left fielder might hit opposite field 60% of the time. If you’ve been placing him wrong for two seasons, it’s time to listen to the data.
The beauty of these tools is their passivity. They collect data while you coach, creating a detailed profile of each player. But, the challenge is using this info well. A spray chart in the cloud is only useful if you use it.
To get the most from these apps, review the data before each practice. Let the data challenge your instincts. One will win, and it should be the one backed by facts.
Practice Design with Data: Constraint Drills to Move One Number at a Time
Think of practice design as a puzzle where data provides the missing pieces for optimal performance. Using data in your drills is more than a trend; it’s a game-changer. With tools like the Blast Motion sensor, you can collect a lot of metrics. But, it’s not about overwhelming players with numbers.
Instead, use those numbers to improve skills without losing the fun of the game.
Constraint-based drills are key to effective practice design. They work by changing one thing in the environment to force a specific improvement. For example, to increase bat speed, use a slightly heavier bat for a few swings. Then, switch back to the regular bat.
The nervous system adapts to the heavier load, showing higher velocity with the normal bat. Measure before and after. Celebrate the improvement.
This “one number at a time” approach is not just about focus; it’s about sanity. Trying to improve too many things at once is like playing whack-a-mole with biomechanics. Instead, focus on one metric at a time.
Design every drill around it. Let other numbers float. Athletes will improve faster and understand why, which is key to training and performing well.
| Metric | Before Drill | After Drill | Improvement |
|---|---|---|---|
| Bat Speed | 65 mph | 66 mph | +1 mph |
| Attack Angle | 12° | 13° | +1° |
| Contact Point | 3 ft in front | 3.5 ft in front | +0.5 ft |
By using constraint drills, coaches can help athletes reach their goals and understand their performance better. For more on constraint-based learning, check out this resource.
Data Ethics, Privacy, Age Limits, and Parent Communication
Technology in youth baseball is exciting, but it raises big questions about data ethics. Coaches now handle huge amounts of data from tools that track everything. But, the big question is: who owns this data?
Imagine having to tell parents their child’s biometric data is stored somewhere far away. It’s a nightmare. The truth is, youth baseball technology can improve performance but needs to be open. Parents should know what data is collected, where it’s stored, and who can see it.
We also need to think about age limits. A seven-year-old doesn’t need to know their exit velocity. Knowing too much about their performance can be harmful. Instead, it’s important to talk openly with parents.
By talking openly, you can avoid scary meetings with parents. You can build trust and understanding. For more on keeping youth sports data safe, read this informative article.
Building a Shared Dashboard: Season KPIs and Progress Notes
A shared dashboard is key for any coaching team. It turns good plans into real results. It’s where dreams of winning come to life or fade away.
Choose a tool like Google Sheets, Notion, or a special platform. The goal is to make everything visible. Your dashboard should track important KPIs that match your team’s goals.
For hitters, it might be how often they hit the ball in the outer third. For pitchers, it could be how often they throw a first-pitch strike. Pick a few key metrics that show real progress, not just random numbers.
Don’t forget about progress notes. They’re the hidden gems of your dashboard. A simple note after each game or practice can tell a lot. For example, “Billy’s stride direction improved today; he’s getting better at hitting off-speed pitches.”
These notes tell a story of growth over time. They’re more valuable than any single number.
When sharing your dashboard, keep it simple. Show it to parents once a month, not every day. It’s better to let them see the big picture and celebrate the progress. This way, everyone can enjoy the journey, not just the end result.
Case Study: One Team’s 8-Week Improvement Using Only Video and Charts
A 14U travel baseball team in suburban Ohio chose simplicity over high-tech gadgets. They used just two iPhone tripods and a free video app. The coach, a former college player, believed in keeping things simple.
He filmed every game and bullpen session from different angles. After each game, he spent twenty minutes logging data into a Google Sheet. He tracked contact rate, first-pitch strikes, and more.
In eight weeks, the team’s batting average jumped by 34 points. Strikeouts dropped by 22%. Errors on routine plays almost halved. Most importantly, every player wanted to keep playing.
This story isn’t about the need for fancy baseball technology. It shows how video analysis and feedback can lead to big improvements. The players learned from their mistakes and saw their progress on charts.
The coach’s focus on consistency made everyone accountable without feeling overwhelmed. The team’s success proves that sometimes, the simplest tools can lead to the biggest gains.